 Bojan
BojanWhat Most Manufacturers Get Wrong About Operational Visibility
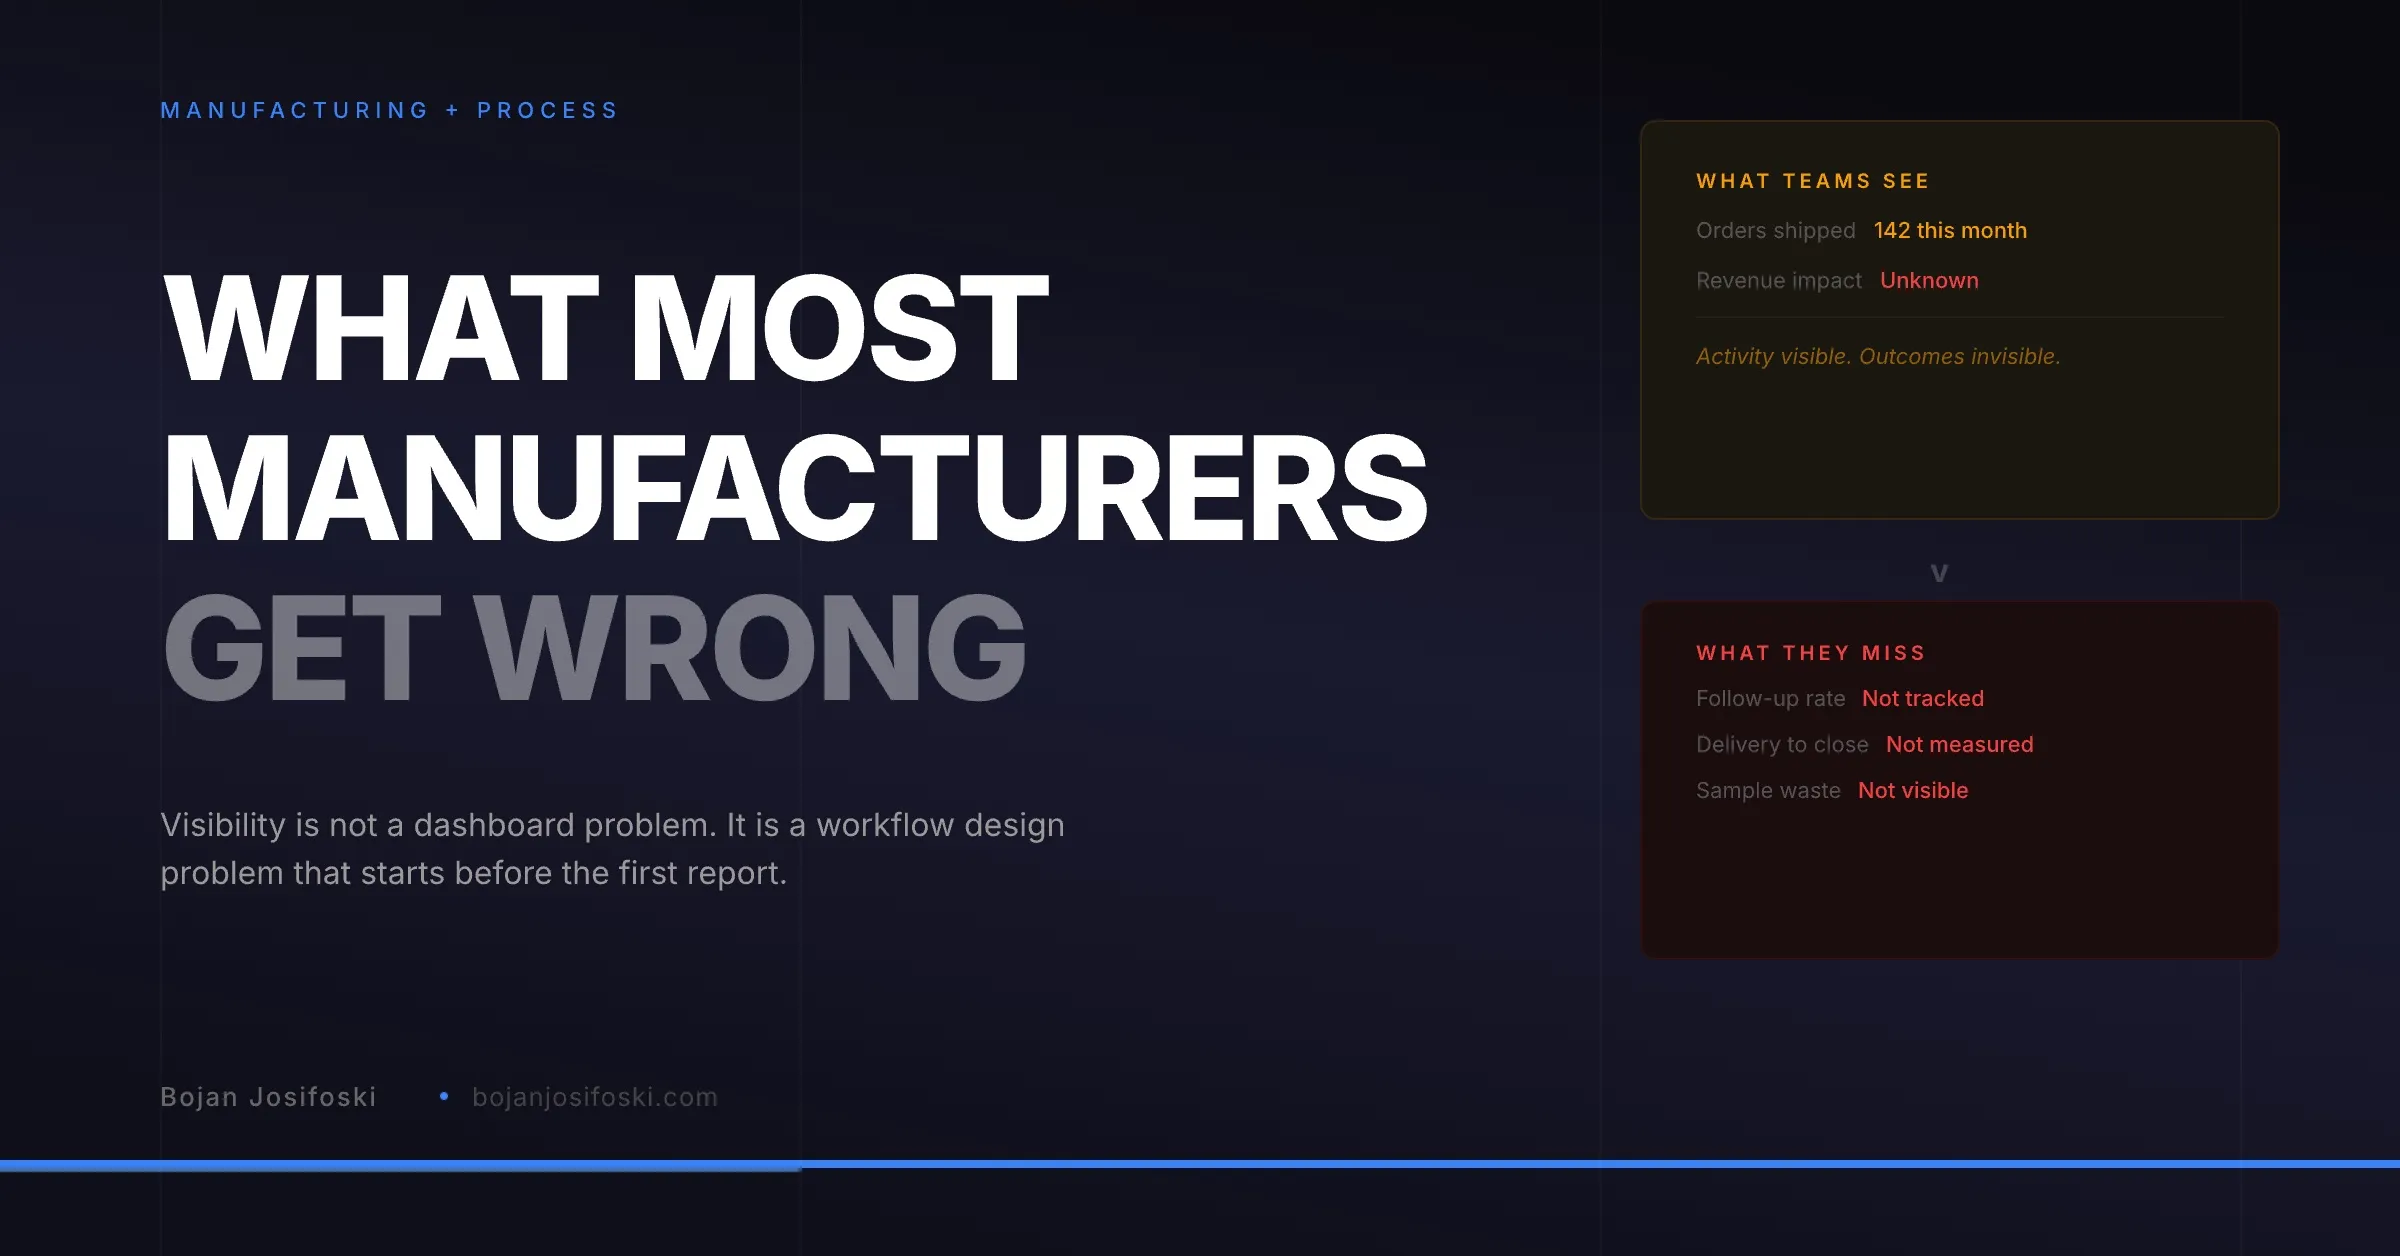
Visibility is not a dashboard problem. It is a workflow design problem. If your processes do not emit the right data at the right time, no reporting tool will give you the answers you need.
When manufacturing leaders talk about wanting better visibility into their operations, they almost always describe it as a reporting problem. They want a dashboard. They want charts that show throughput, turnaround time, and activity by team member. They want to export data to a spreadsheet for quarterly reviews.
The problem is that these requests assume the data exists. In most operations, it does not. Not because nobody thought to track it, but because the workflows that generate the data were never designed to capture it. You cannot build a dashboard on top of a process that does not record what happens.
Visibility Is an Upstream Problem
Consider a simple question: what is the average time from sample request to delivery? To answer this, you need four timestamps: when the request was submitted, when it was approved, when it was shipped, and when it was delivered. If any of these timestamps is missing, the calculation is impossible.
In most sample operations, at least one of these is missing. Requests come through email, so there is no structured submission timestamp. Approval happens verbally, so there is no record of when it occurred. Shipping might be tracked, but delivery confirmation requires checking carrier websites, which nobody does consistently.
The visibility problem is not that you lack a dashboard. It is that your workflow does not emit the events a dashboard would need. Fixing this requires changing the workflow, not buying a better reporting tool.
What Workflows Need to Emit
A workflow that supports visibility needs to generate events at specific points. Each event should capture: what happened, when it happened, who triggered it, and what entity it relates to (order, sample, shipment).
The critical events for sample operations are: request submitted, request approved, order created, order assigned to fulfillment, shipment created with carrier and tracking, delivery confirmed, and follow-up completed. Each of these is a moment where the state of an order changes, and each one creates a data point that reporting can use.
If your workflow captures all of these events with timestamps and attribution, you can answer almost any operational question. Average turnaround time. Bottleneck identification (where do orders sit longest). Rep performance (who requests the most, who follows up the fastest). Fulfillment throughput. Delivery success rate.
If your workflow misses even one event, entire categories of reporting become impossible. Spreadsheet-based processes typically miss most of them.
The Audit Trail as a Visibility Foundation
An audit trail is not just a compliance feature. It is the foundation of operational visibility. Every action logged with a timestamp, a user, and a description of what changed creates a queryable history of your operations.
When leadership asks “why did this order take two weeks?” the audit trail shows exactly where the delay happened. Was it sitting in the approval queue for five days? Was fulfillment backed up? Was the carrier slow? Without an audit trail, the answer is always a guess.
When I built the operational system behind SampleHQ, the audit trail was one of the first features, not an afterthought. Every status change, every assignment, every shipment update, every CRM sync is logged. The reporting layer reads from this trail to produce dashboards that reflect what actually happened, not what people remember happening.
Role-Based Views, Not Universal Dashboards
One mistake I see consistently is the attempt to build a single dashboard that serves everyone. A VP, a sales rep, and a fulfillment lead need completely different information. Forcing all three to look at the same dashboard means the dashboard is either too detailed for the VP or too high-level for the fulfillment lead.
Role-based views solve this. The VP sees aggregate metrics: total samples shipped, revenue attributed, turnaround trends, team performance. The sales rep sees their orders: status, delivery dates, deals linked, attribution credited. The fulfillment lead sees their queue: what needs to ship today, what is delayed, what is waiting on approval.
All three views read from the same data. The difference is filtering, aggregation, and emphasis. This is a design decision, not a technical limitation. But it matters because visibility that does not match the viewer’s needs is visibility that does not get used.
Connecting Operational Visibility to Revenue
The highest-value form of operational visibility is the connection to revenue. Not just “how many samples did we ship” but “how many of those samples appeared in deals that closed, and what was the total attributed revenue.”
This is where most manufacturers stop short. They invest in operational tracking but never connect it to commercial outcomes. Revenue attribution requires a linking model between orders and deals, which requires CRM integration, which requires a system designed to support both operational and commercial data.
Without this connection, the sample program remains a cost center. Leadership sees the expense but cannot see the return. With this connection, the conversation changes from “are we spending too much on samples?” to “how do we allocate sample resources to the highest-converting accounts and products?”
Start With the Workflow
If you want better visibility, do not start with dashboards. Start with workflows. Design your sample process to emit structured events at every meaningful state change. Store those events with timestamps and user attribution. Build role-based views that surface the right information to the right people.
The dashboard is the last step, not the first. It is the output of a well-designed operational system, not a substitute for one.
SampleHQ was built with this principle. Structured workflows emit events. Events feed dashboards. Dashboards connect to CRM data for revenue visibility. The reporting works because the process underneath it was designed to produce the data.